99% of Earthlings See Sunlight on July 8 (And on Other Dates, Too)
By Konstantin Bikos and Graham Jones. Published 4-Jul-2023![]()
Last year, we confirmed an internet meme claiming 99% of the world’s population gets sunlight at the same time on July 8. In fact, this happens on a whole range of dates—but only around a specific time of day.
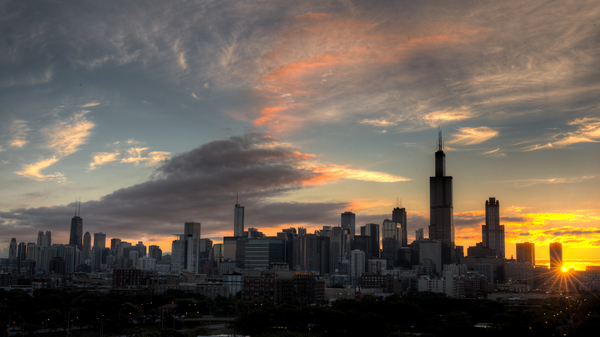
Sunrise over Lake Michigan: this is how one of the moments when 99% of the world’s population experiences sunlight looks in Chicago, USA. At this time of year, with DST in effect, 11:00 UTC translates to 6 am local time.
©iStockphoto.com/Thomas Campone
Myth: Confirmed
It seemed like an implausible claim that circulated the internet last year. And yet, our number crunchers confirmed it: 99% of the world’s population really do receive some degree of sunlight at 11:15 UTC on July 8 each year. (That is if you count the 3 percent that experiences astronomical twilight, which is hardly discernible from nighttime.)
At that moment, most populated areas are on the day side of Earth or in one of the twilight zones. The only large landmasses on the night side are Australia, New Zealand, and parts of Southeast Asia and Antarctica.
When do most people experience night?
Looking at the Year as a Whole
With July 8, 2023 just around the corner, we decided to expand our focus, and also answer one or two of the questions that have come our way since last year:
- Is July 8 the only date this happens? If there’s a peak on that date, around 17 days after the June solstice, shouldn’t there be another one 17 days before the solstice?
- What happens to the sunlight population numbers if we alter the clock by a few minutes?
To answer these questions, we looked at the number of people experiencing day, night, or twilight at every minute of every day of the year.
As before, all our calculations are based on timeanddate’s Sun data and population data from the Center for International Earth Science Information Network at Columbia University in New York.
60 Instances of “Global Sunlight”
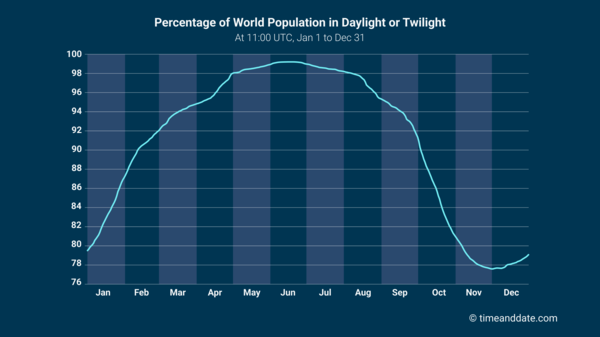
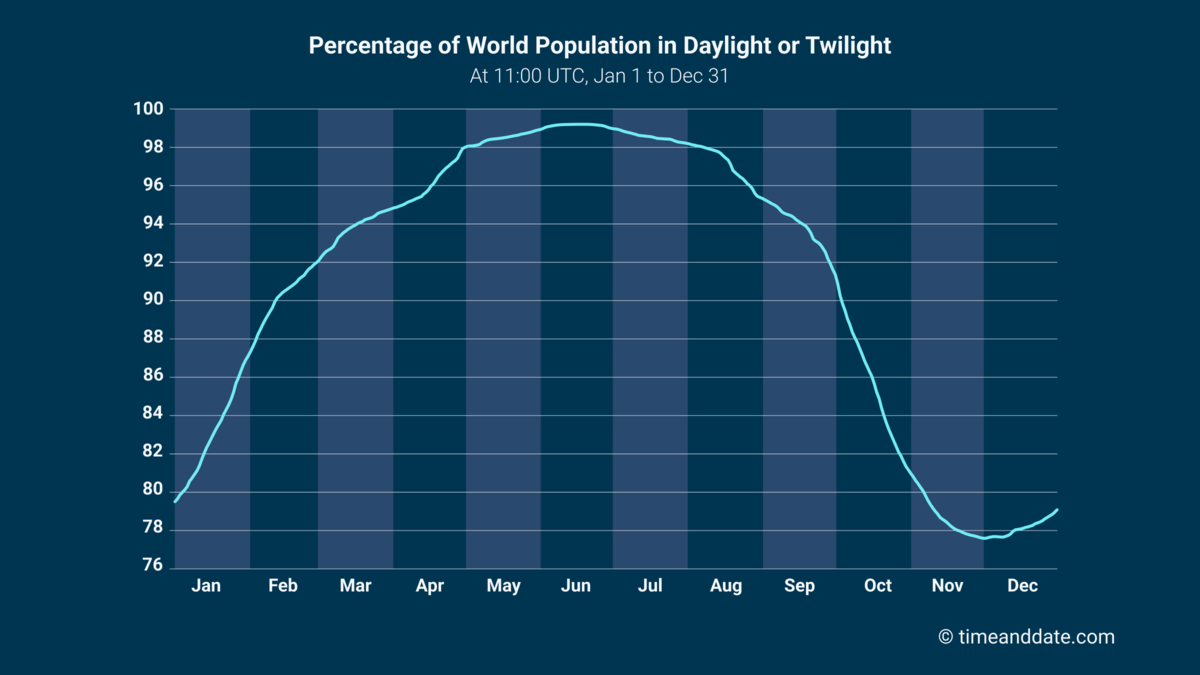
Share of the world’s population experiencing daylight or twilight at 11:00 UTC each day of the year. Note how the curve plateaus around the June solstice and remains well above the 98% line for about two months. (Even in December—in the depths of the Northern Hemisphere winter—more than three-quarters of the world’s population are in daylight or twilight at 11:00 UTC.)
©timeanddate.com
As the chart shows, July 8 is not the only date when sunlight reaches all but one percent of people on Earth—far from it!
The chart above shows the share of the world’s population experiencing daytime or twilight at 11:00 UTC every day of the year. Note how the curve approaches the 99% threshold as early as May, then plateaus for nearly all of June, and eventually drops back toward the 98% line in mid-July.
According to our numbers, this period begins around May 18 and ends around July 17. In other words, there are about 60 days around the June solstice when, for a few minutes every day, 99% of humans on Earth get daylight or twilight (rounded to the nearest percent).
So yes, the claim checks out for both July 8 and June 4 (17 days before the solstice)—but also for about 58 other days during that time of year.
The Daily Peak Is Closer to 11:00 UTC

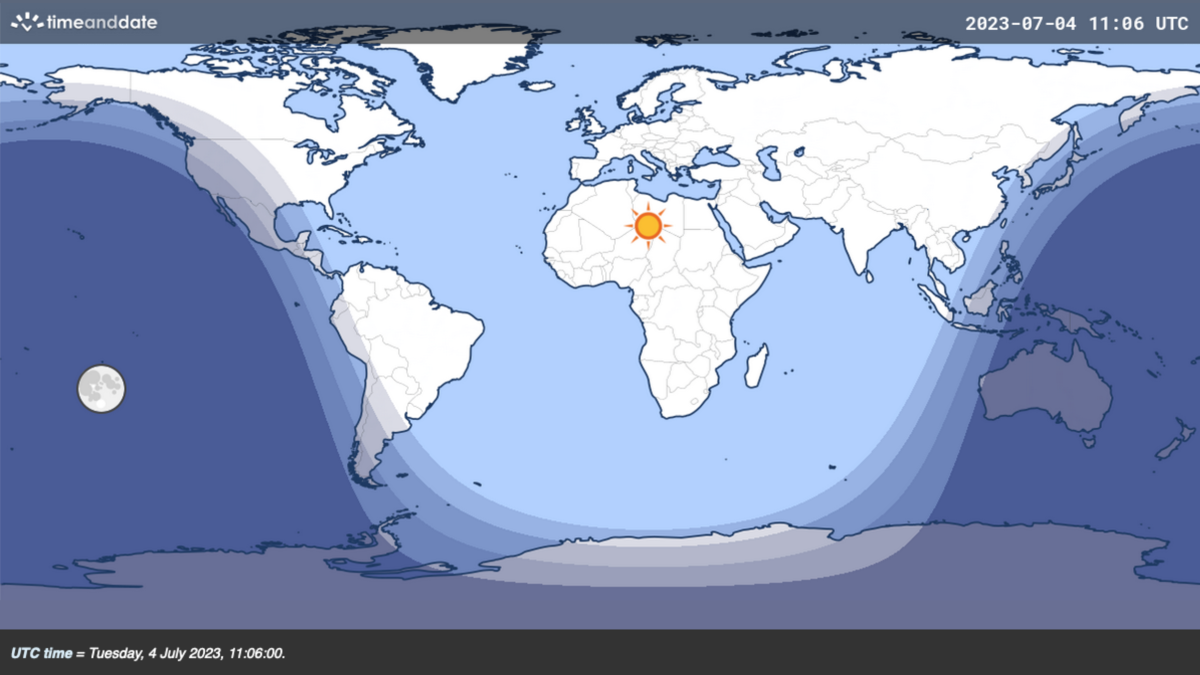
Our Day and Night World Map shows one of the moments when most of the world’s landmasses receive some sunlight around 11:00 UTC.
©timeanddate
You may have noticed that we based our chart on the global distribution of sunlight every day at 11:00 UTC instead of 11:15 UTC, the time mentioned in the original internet meme that we fact-checked last year.
That’s because our numbers show that, on average, the daily peak occurs closer to 11:00. On all of the 30 days with the largest amount of people experiencing sunlight, the peak moment occurs between 11:00 and 11:03 UTC; among the top 60 days, it falls a minute or two later in just a handful of cases.
Convert 11:00 UTC to your local time
The fun fact here is that July 8 is indeed one of the few dates when the peak happens a little later: at 11:10 UTC, according to our calculations. So, even though our numbers, on average, favor an earlier time, the creator of the internet meme hit the mark exceptionally well!
Our Day and Night World Map uses different shadings for day, night, and the three stages of twilight:
- The lightest shading represents daytime when the Sun is above the horizon.
- The darkest shading is nighttime when the Sun is below the horizon, and there’s no twilight.
- The shadings between day and night are the three stages of twilight when the Sun is below the horizon, but there’s still some indirect sunlight.
Explaining the Wobble
If you take another peek at the chart above, you will notice the line is a bit wobbly. In fact, that wobbliness points to one of the reasons we find digging into this data so exciting!
It shows how even the tiny day-to-day changes in the distribution of sunlight around the solstice can have quite large effects on the corresponding population numbers.
A sparsely populated area might be just inside the twilight zone on one day and at nighttime on the next; on the other side of the globe, a major city may have simultaneously joined the twilight zone, causing a noticeable bump in the curve.
Asymmetrical Rise and Fall
At the same time, the curve isn’t symmetrical about the June solstice or December solstice. Earth’s elliptical orbit is a factor here, causing our planet to speed up and slow down on its way around the Sun. This is connected to the equation of time, which measures variations in the apparent solar time throughout the year.
In practice, this means that the Sun’s apparent movement across the sky slightly changes speed, causing the moment when most people get sunlight to occur a bit earlier or later from one day to another.
This causes a slight distortion in our graph, which does not take these variations into account, rigidly plotting the sunlight population data at precisely 11:00 UTC each day.
Take It with a Grain of Salt
While we’re confident in our calculations and data sets, it’s worth repeating that determining how many people experience day, night, or twilight at any one moment is a rather messy business.
For one, the world’s population isn’t static. It changes over time, and in some locations, it does so at a different pace than in others. We based our calculations on the best population data sets available—but they are from 2020.
What’s more, the margins are minuscule. While our algorithms did identify a specific instant when most people get some degree of sunlight—11:02 UTC on June 23—the population numbers for the days on either side of this date are just a tiny fraction smaller. We’re talking a few tens of thousands of people—peanuts compared to the world’s population.