The Hidden Patterns of Venus’s Movement across the Sky
Venus performs a dazzling 19-month dance as the morning and evening star. But digging into the data reveals more subtle patterns.
UPDATE (October 19, 2023): Venus delighted sky-watchers last month as the planet reached its maximum brightness. Next, on October 23, Venus arrives at its farthest point in the sky from the Sun.

Venus is often impossible to miss as it shines near the Sun in the early-morning or early-evening sky. In September 2023, Venus glows brightly in the east before sunrise.
©iStockphoto.com/PavelRodimov
The Dazzling Planet
After the Sun and the Moon, Venus is the brightest natural object in the sky.
The planet dances in the sky in a way that is hard to miss. Over the course of 584 days—just over one year and seven months—it moves gracefully from the morning sky to the evening sky and back again.
Find Venus on our Night Sky Map
Each time, however, it moves in a slightly different way, producing patterns that can only be revealed by plotting data over many thousands of years (see below).
September 2023: Venus in the Morning Sky
In 2023, toward the end of August, Venus emerged from the glare of the Sun, and began a roughly seven-month reign as “the morning star.” It’s easy to spot in the eastern sky before sunrise.
Venus reaches its maximum brightness around September 17.
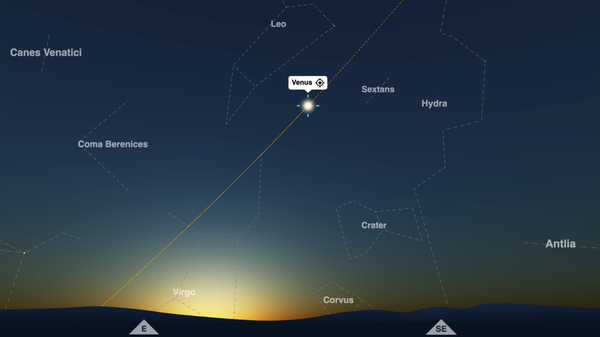
A month or so later, on October 23, it reaches its farthest distance from the Sun in the morning sky. Astronomers call this the planet’s greatest elongation west.
Astronomy calendar: things to see in the sky


Venus at its farthest distance from the Sun in the morning sky. This view from our Night Sky Map is taken looking east from New York City, 30 minutes before sunrise on October 23, 2023.
©timeanddate.com
Next Year: Venus Moves into the Evening Sky
In April 2024, Venus disappears back into the glare of the Sun. In July 2024, it re-emerges in the western sky, and begins seven months or so as “the evening star.”
The planet arrives at its farthest evening distance from the Sun—greatest elongation east—on January 10, 2025.
In March 2025, Venus is again swallowed by the Sun, and is reborn as the morning star.
The entire cycle of Venus—from morning star to evening star and back again—takes 583.92 days to complete. Astronomers refer to this as the synodic period of Venus.
Why Greatest Elongation West and East?
When Venus is the morning star, it reaches greatest elongation west. This name can be confusing because, in the morning, Venus shines brightly in the eastern sky. However, Venus lies west of the Sun as the pair travel across the sky from the eastern horizon to the western horizon.
Likewise, when it shines as the evening star in the western sky, Venus lies to the east of the Sun as they journey from east to west.
Why Is Venus Never Too Far from the Sun?
Venus orbits the Sun more closely than Earth does. This means that, from our perspective, the planet always appears to be somewhere near the Sun.
The maximum distance in the sky between Venus and the Sun—in other words, the distance at greatest elongation—is, roughly speaking, 46°.
Movement within Movements
Hidden inside the eye-catching motions of the morning star and evening star are more subtle patterns.
Venus’s maximum distance from the Sun is never precisely the same from one greatest elongation to the next: it varies by a few degrees.
However, as we noted in a story in June, Venus repeats a near-identical sequence of greatest elongations every eight years.
This repetition occurs because Venus’s synodic period (583.92 days) falls into alignment with Earth’s sidereal year, which is the period of its orbit around the Sun with respect to the stars (365.26 days).
- 8 Earth sidereal years = 8 x 365.26 days = 2922.08 days
- 5 Venus synodic periods = 5 x 583.92 days = 2919.60 days
- Difference = 2.48 days
Subtlety within Subtleties
Yet there are even more subtle rhythms underpinning Venus’s movements. The eight-year sequence of greatest elongations repeats in a near-identical way—but not a perfectly identical way.
We wanted to see what would happen if we plotted the greatest elongations of Venus over many thousands of years.
To do this, we used a mathematical model of the solar system called Development Ephemeris 431 (DE431), created by NASA’s Jet Propulsion Laboratory (JPL) at the California Institute of Technology. DE431 predicts the positions of the planets over a period of around 30,000 years.
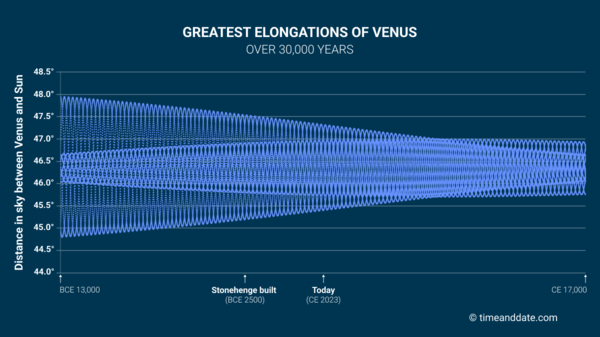
The following chart shows every greatest elongation of Venus from BCE 12,999 (roughly 15,000 years ago) to CE 16,999 (roughly 15,000 years into the future).
Each dot on the chart represents a greatest elongation; there are 37,530 dots in total.


This chart is made up of 37,530 dots—these represent Venus’s angular distance from the Sun at every greatest elongation over a period of 30,000 years. (To help put this time frame into perspective, the prehistoric monument of Stonehenge was built around 4,500 years ago.)
©timeanddate.com
Waves across Time
When we crunched the numbers and plotted the data on the chart, we found the dots form ten lines that run from left to right as waves.
The dots within each individual line are separated by eight years: these are the near-identical greatest elongations that take place every eight years.
If greatest elongations were perfectly identical every eight years, there would be ten horizontal lines running across the chart. Instead, because greatest elongations differ by a tiny fraction of a degree every eight years, the result is ten wavy lines.
Families of Waves
We can see from the chart that all greatest elongations of Venus are within a few degrees of 46°.
We can also see that the ten wavy lines from two groups of five lines each.
One group of lines shows bigger differences in the peaks and troughs of its waves. These are greatest elongations east, or evening elongations.
On the left side of the chart, these evening elongations have a range of more than three degrees, from around 44.8° to 47.9°. On the right side of the chart, their range has narrowed to about half a degree, from 46.0° to 46.6°.
The other group of lines shows smaller differences in the highest and lowest points of its waves. These are greatest elongations west, or morning elongations.
Roughly 6000 years from now, these morning elongations reach a point of maximum variation. Here they have a range of about one-and-a-quarter degrees, from 45.7° to 47.0°.
Where are we now? Venus’s greatest elongation west of October 2023 is 46.41°, more or less in the middle of the chart.
Off the Chart
The point of maximum variation for greatest elongations east is not shown in our chart. It happens somewhere off the chart to the left, many thousands of years in the past.
Similarly, the point of minimum variation for greatest elongations east is somewhere off the right side of the chart, a long way into the future.