How Many Millions Live in the Path of Upcoming Eclipses?
By Graham Jones. Published 27-Feb-2023![]()
31.5 and 42.6 million people live along the paths of annularity and totality for the 2023 & 2024 solar eclipses across the Americas. But which upcoming eclipse passes over the biggest resident population?

Most people have to chase eclipses—but for some, totality comes to them. Here, a crowd in the town of Chapel Hill, North Carolina, (with a population of roughly 60,000) awaits the Great American Eclipse of 2017.
©iStockphoto.com/Ryan Herron
Counting the Numbers of Eclipsed People
Here at timeanddate, we recently added detailed population data to our solar and lunar eclipse pages.
We took population estimates from the Center for International Earth Science Information Network (CIESIN) at Columbia University in New York, and combined them with our algorithms for calculating eclipses.
This means we now offer detailed figures to show how many people live in areas where different kinds of eclipses are visible: total, annular, partial, and penumbral.
We presented our eclipse population data for the first time at the Europlanet Science Congress 2022 in Granada, Spain.
The moments when 99% of people see sunlight
The Biggest Eclipses by Population
Lunar eclipses, which are visible from anywhere on the nighttime side of Earth, can be seen by billions of people.
Between 2023 and 2040, the biggest total lunar eclipse by this measure will be on December 20–21, 2029. Weather permitting, totality will be visible for 7.1 billion people, or around 89% of the world’s population.
Solar eclipses, on the other hand, are limited to much smaller areas. Typically, the path of totality or annularity is about 200 km (125 miles) wide.
In the next few years, there is only one solar eclipse where the resident population in the path of totality or annularity exceeds 100 million (0.1 billion) people. This is the total eclipse of March 20, 2034, across Africa and Asia.
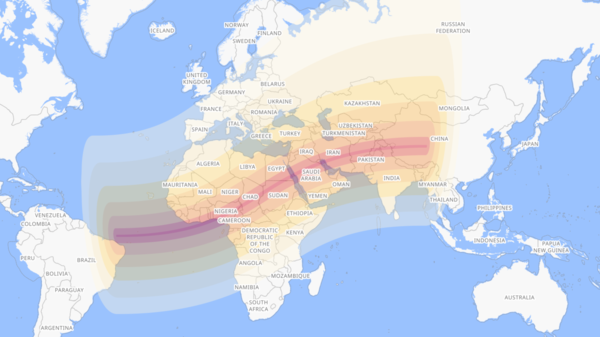
A world map for the total solar eclipse of March 20, 2034. The path of totality is the dark, extremely narrow stripe across the center of the map. For the areas covered by lighter shading, a partial eclipse will be visible.
©timeanddate
The Top 10 Solar Eclipses
The table below shows the 10 biggest eclipses from 2023 to 2040 in terms of the number of people who live along the path of totality or annularity.
The big solar eclipses coming soon to the Americas—on October 14, 2023, and April 8, 2024—rank 10th and 7th respectively.
Top 10 Solar Eclipses by Population, 2023–2040
| Rank | Date | Eclipse Type | Population Seeing Totality or Annularity |
|---|---|---|---|
| 1. | March 20, 2034 | Total | 102,000,000 |
| 2. | August 2, 2027 | Total | 85,800,000 |
| 3. | June 1, 2030 | Annular | 74,500,000 |
| 4. | September 2, 2035 | Total | 71,800,000 |
| 5. | May 21, 2031 | Annular | 70,000,000 |
| 6. | February 6, 2027 | Annular | 60,800,000 |
| 7. | April 8, 2024 | Total | 42,600,000 |
| 8. | January 5, 2038 | Annular | 41,900,000 |
| 9. | January 26, 2028 | Annular | 38,800,000 |
| 10. | October 14, 2023 | Annular | 31,500,000 |
Sources: timeanddate.com, CIESIN (GPWv4 Revision 11)
Based on 2020 Population Figures
The figures above refer to the resident population—they do not include visitors who travel into the path of totality or annularity on the day of the eclipse.
It’s also important to note that the figures are based on population estimates from the year 2000 to 2020: they do not reflect changes in population since 2020.
Diving into Our Data
We’ve been seeing what else we can do by combining population estimates with our algorithms for the Sun and Moon.
For example, we calculated the moments in the year when most of the world’s population is either in sunlight or in darkness.
99% of the world’s population gets sunlight at the same moment on July 8
On Dec 6, a minute of global darkness
How We Did It
For these kinds of population calculations, looking at every pixel of the world map takes too many days of computing time.
Instead, we used a technique known as tessellation, where a large set of data is divided into blocks called polygons. An example of this process is shown below.
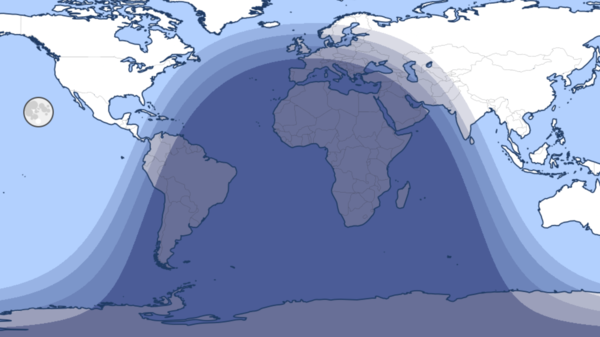
Our Day and Night World Map shows the areas of the world in daytime (the light area), nighttime (the dark area), and twilight (the thin grey areas in between).
©timeanddate

In this image, the above areas have been cut up into small four-sided shapes. “When we do the computation for population, instead of having to go through every pixel, we ask how many people live in each block,” explains timeanddate’s Ardijan Rexhaj.
©timeanddate
The final step in preparing our eclipse population data was to decide the best way to present the numbers on our web pages.
“After we finished the calculations, we spent two or three days discussing things like how much to round the numbers,” notes timeanddate’s Frank Tveter.
In the end, we decided to round the number of people to three significant figures, and also give this as a fraction of the total number of people in the world.
For example, we give the population figure for the path of totality across North America on April 8, 2024 as 42,600,000, or 0.54% of the world population.